DIY Retirement Modelling: Building a Dynamic Excel Cash Flow Forecast
Build a dynamic retirement cash flow model Excel spreadsheet to stress-test your income, expenses, and tax strategy across every phase of retirement.



Build a dynamic retirement cash flow model Excel spreadsheet to stress-test your income, expenses, and tax strategy across every phase of retirement.
To build a dynamic retirement cash flow model excel workbook, set up dedicated assumption inputs for inflation and returns, establish a year-by-year timeline matching guaranteed income against categorized expenses, and apply tax-bucket sequencing across taxable, tax-deferred, and Roth accounts.
While static financial calculators typically rely on fixed rules of thumb like withdrawing a straight 4% annually, this basic formula ignores the messy reality of human life. Real retirements do not follow linear paths: spending spikes in active early years, healthcare costs accelerate later, and income streams like Social Security or pensions kick in at staggered dates.
Building a custom spreadsheet allows you to forecast actual purchasing power over multi-decade horizons. By mapping your finances on a yearly schedule, you can evaluate how sequence-of-returns risk affects your portfolio during early distribution phases. If market downturns strike right as you start withdrawing principal, a static calculation will mask the damage until your nest egg is severely compromised.
Spreadsheet modeling also lets you account for longevity risk and variable lifestyle spending. Using resources like the open-source Retiree Portfolio Model, DIY planners can simulate detailed tax brackets, longevity assumptions, and customized asset allocations. When combined with core cash-flow principles like learning how to build a flex budget, an Excel workbook becomes an adaptable decision engine rather than a rigid set of guesses.
Saving for retirement and spending in retirement require entirely different mindsets. During the accumulation phase, your goal is straightforward: maximize contributions, harness compounding interest, and ride out market dips.
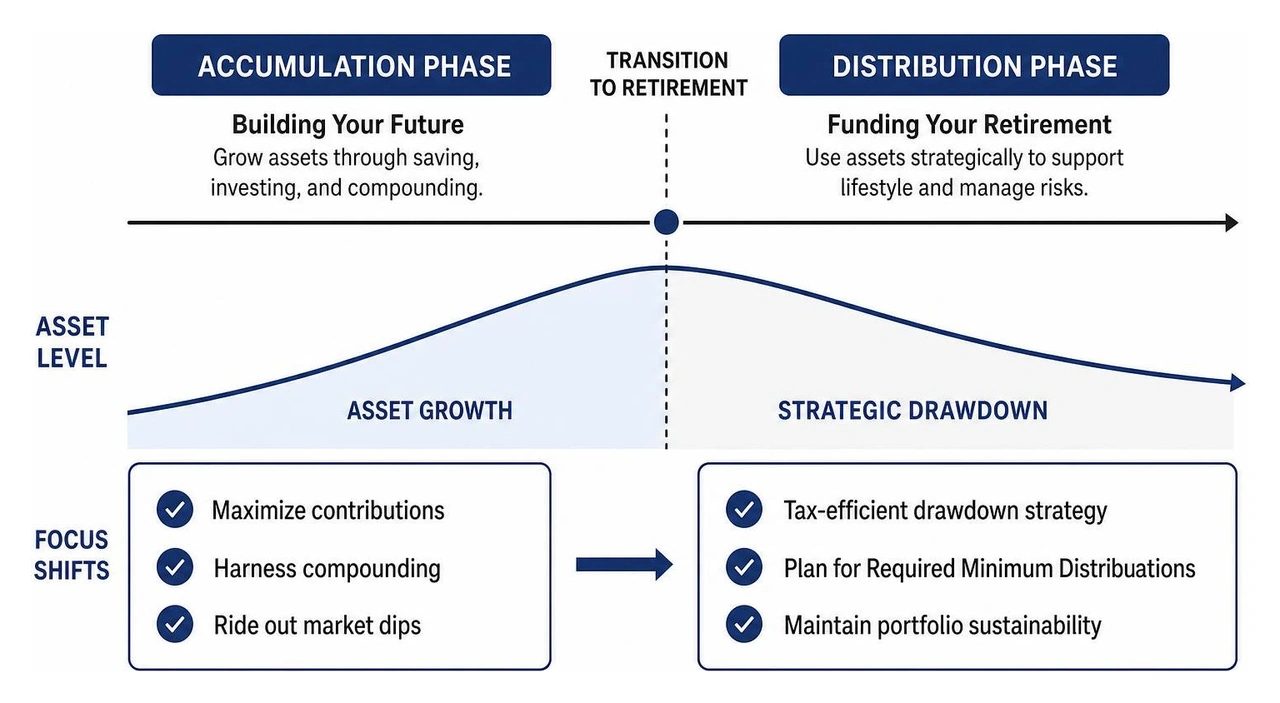
The distribution phase, however, introduces complex operational risks:
Those pursuing Financial Independence, Retire Early (FIRE) face modeling challenges that traditional retirees do not. A standard retirement timeline might span 25 to 30 years, whereas an early retiree leaving the workforce in their 30s or 40s must model a 40- to 55-year horizon.
As we explore in our guide on whether having enough money to retire early is the whole solution, early exits require dedicated "bridge funding." You must sustain your lifestyle for decades before accessing penalty-free withdrawals from traditional retirement accounts at age 59½.
Furthermore, early retirees cannot rely on Medicare (which starts at 65) or Social Security (available between ages 62 and 70). Your spreadsheet must explicitly account for private health insurance premiums and bridge funding mechanisms such as taxable brokerage drawdowns, Rule 72(t) SEPP distributions, or Roth conversion ladders.
A clean financial model is structured with dedicated worksheets rather than cluttering calculations on a single page. Separating your core assumptions, cash flow ledger, and visual outputs makes auditing formulas simple and prevents broken references when testing scenarios.
To ensure mathematical consistency, your model must distinguish between nominal returns (growth before inflation) and real returns (purchasing power growth after inflation). If you use nominal returns of 6% to 7%, you must inflate your future living expenses each year by a baseline inflation assumption (historically 2.5% to 3.0%).
Your assumptions tab serves as the engine room of the workbook. As demonstrated in popular tools like the Eloquens Retirement Planner Model, establishing clear parameter inputs allows you to update your entire plan by changing just a few master cells:
Retirement income rarely arrives as a single paycheck. Your model needs dedicated columns for each income stream, complete with starting and ending age triggers.
Understanding the tax treatment of these income streams is critical. As analyzed in the Roth 401(k) vs Traditional 401(k) debate, pre-tax withdrawals create ordinary taxable income that directly impacts how much of your Social Security benefit is subject to federal income tax.
A common modeling mistake is applying a flat inflation rate to all household spending. To capture realistic expenses, split your budget into three distinct categories:
Follow this step-by-step framework to build your year-by-year cash flow forecast engine from scratch.

In Column A, list your projection years starting with the current calendar year. In Column B, list your projected age for each corresponding year. If modeling for a couple, add a column for your spouse's age.
Create adjacent columns for your income streams:
=SUM(C5:E5))=Prior_Year_G * (1 + $Assumptions$B$4))=Prior_Year_I * (1 + $Assumptions$B$5))=SUM(G5:I5))In Column K, calculate your net annual cash flow shortfall:
If total guaranteed income exceeds outflows, this cell returns zero; if expenses exceed income, it reveals the exact portfolio withdrawal required to fund your lifestyle for that year.
| Feature | Static Withdrawal Calculator | Dynamic Cash Flow Model |
|---|---|---|
| Spending Flexibility | Assumes flat annual real spending | Adjusts for lifestyle phases & one-time expenses |
| Tax Integration | Overlooks account-specific tax burdens | Models distinct tax buckets and sequencing |
| Income Timing | Treats all assets as an upfront lump sum | Staggers Social Security, pensions, and sales |
| Inflation Modeling | Applies a single uniform rate | Applies distinct rates for general CPI vs. healthcare |
| Surplus Handling | Disregards excess income | Reinvests surplus cash flow back into reserves |
Once you know the annual funding gap, design the drawdown order across your investment accounts. The standard tax-efficient withdrawal sequence generally follows:
Structuring your accounts properly during your working years makes drawdown planning far easier. Our breakdown of Roth vs. Traditional accounts shows how early asset location decisions give you the flexibility to manage your taxable income bracket-by-bracket in retirement.
A retirement plan is only as strong as its performance during rough market environments. Once your core cash flow schedule is running, use Excel's native tools to reveal vulnerabilities.
Flagging "Danger Years": Danger years occur when your portfolio withdrawal rate exceeds 5% of your total balance. Create an alert column using an IF statement:
Visual Depletion Curves: Insert an Excel Area or Stacked Line chart tracking your portfolio balance over time. A visual curve shows immediately if your assets plateau safely or decline toward zero late in retirement.
Spreadsheets provide total control, but user errors in formulas or assumptions can create a false sense of security. Watch out for these common traps:
Reviewing practical planning case studies can help you see how these compounding risks interact in real-world retirement scenarios.
For a balanced retirement allocation (such as 60% equities and 40% fixed income), conservative planners generally assume an average annual nominal return between 5.0% and 6.5%, or a real return (after inflation) of approximately 2.5% to 3.5%. Relying on aggressive pre-retirement equity returns (like 9% to 10%) leaves no margin of safety for market pullbacks or sequence risk.
Do not bundle medical costs into general living expenses. Create a separate healthcare expense row and index it using a dedicated 5.0% to 5.5% annual growth rate. In the year you turn 65, reset your healthcare baseline to reflect Medicare Part B and Part D premiums, supplemental Medigap coverage, and anticipated out-of-pocket maximums.
While building a dynamic spreadsheet is an empowering exercise, DIY modeling has limits when managing high-net-worth portfolios, multi-state tax liabilities, Roth conversion timing, dynamic estate strategies, and complex executive compensation drawdowns. If your model reveals close margins, or if you want an objective stress test of your tax and withdrawal strategy, consulting a fee-only fiduciary advisor ensures your plan accounts for factors a spreadsheet cannot easily capture.
Building your own dynamic retirement cash flow model excel workbook gives you deep insight into your financial landscape. By replacing static withdrawal assumptions with detailed income streams, separate inflation rates, and clear tax considerations, you transform abstract balances into a clear, multi-decade roadmap.
A retirement model is an evolving document, not a one-time project. Update your balances annually, adjust for actual cost changes, and stress-test your assumptions as economic conditions shift.
If you would like an experienced, fee-only fiduciary team to stress-test your DIY model, coordinate your tax-efficient distribution strategy, and optimize your wealth management plan, we can help. Request a free assessment with NoDa Wealth to evaluate your retirement readiness and move forward with clarity.
Feeling overwhelmed? Let’s simplify things! Schedule your Free Assessment for an easy, 20-minute chat to help you tackle life’s transitions.
Enjoy a hassle-free conversation that puts your needs front and center!
)%20(3).avif)
